Pioneer Energy in Lakewood, Colo., is a service provider and original equipment manufacturer addressing gas processing challenges in the oilfield with a range of standard gas capture and processing units for tank vapors and flare gas. The company has a line of units that captures hydrocarbon vapors from crude oil tank batteries and extracts natural gas liquids (NGLs) at high yields, instead of sending these valuable commodities to combustion or venting them to the atmosphere.
This dramatically cuts emissions, meets U.S. Environmental Protection Agency Quad-O compliance standards, and provides a significant economic return. Another line of equipment (figure 1) captures and processes flare gas at the well site, producing NGLs and pipeline-quality lean methane and helping producers comply with regulations.
Oil and gas fields in North Dakota, Montana, and Colorado use this equipment at production well sites to capture methane and natural gas liquid streams. Pioneer operates and monitors these geographically disperse units from its headquarters. Operation and design teams monitor the equipment and analyze the results to make continuous improvements.
The FlareCatcher is powered with a natural gas generator, which is inside the white enclosure on the front of the trailer shown in figure 1. The fuel gas for this generator comes from any of the refined energy products made by the FlareCatcher, and this usage is only about 5 percent of the total energy of the gas processed by the equipment.
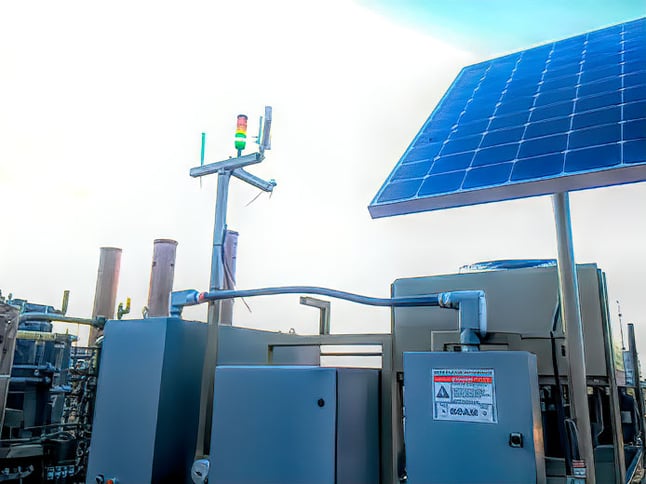
The system has auxiliary (backup) batteries charged with a conventional battery tender powered by the primary generator or a solar panel. The auxiliary power system is required to keep communications alive when the system is not running due to maintenance, a component level failure, or insufficient gas flow from the site. Once the shutdown condition has been remedied, having communications available with headquarters allows remote startup.
Data from afar
The company has systems installed in the western U.S.-and future sites could be onshore or offshore anywhere in the world with cellular or satellite connectivity (figure 2). Alternately, a local radio network could be installed to get the data to a network hub.
Well-site data from the systems is sent to local data centers. This is a critical element of the modular architecture, because it leverages specialized resources. Data centers have extensive redundancies built into their power and networking services, absolutely required for operating critical hardware remotely. The company uses one data center in Denver and one in Dallas, and is investigating virtualization to add dynamic scaling and load balancing to field data gathering. Currently, all analog data is being transmitted at 1-second intervals. Discrete data is transmitted as it changes.
Although data was coming in from field sites to the data centers, there were no sophisticated data analysis tools. If engineers found themselves with some free time, they could manually load historical data into an Excel spreadsheet and calculate a few basic metrics. But Excel is not suitable for calculations of reasonable complexity, so much of the data gathered was not used as it could be. How could the company better analyze data from its far-flung operations?
 Figure 2. Data can be acquired from well sites in any remote location via cellular or satellite communication.
Visual analytics application software
After analyzing various data analytics software packages, visual data analytics application software was selected for utility and ease of use. This included components such as a graph database, time-series optimization, and a clean browser-based interface-plus advanced data analytics and information sharing capabilities. The visual analytics application enables the company to optimize the data stream. It can define simple computations to be performed at the edge to determine what data needs to be streamed to headquarters for analysis, and what data can be archived locally at the sites.
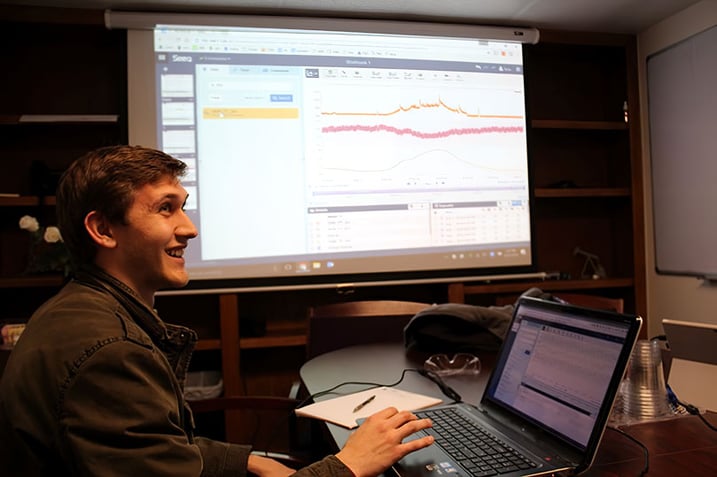
The visual analytics application software is currently being used to analyze and understand historical data, and to generate and define new rules for operating parameters (figure 3). Applications are endless. In a continuous improvement cycle, all data has potential value if it can be unlocked and leveraged. Now there is also an environment for experimentation and learning, and instant visual feedback so engineers can analyze complex data in a reasonable amount of time.
 Figure 3. Engineers can monitor equipment at remote well sites with data analytics software, optimizing the data stream at the edge to focus on the most relevant information.
For example, key components of the technology is advanced refrigeration system designs that can be very sensitive to changing operational conditions. The visual analytics application software enables engineers to isolate these effects, identify their causes, and develop simple operational rules to extend the life of the capital investment.
One of the core value offerings is operating systems remotely. The software helps identify a problem with equipment in the field, so corrective action can be taken quickly. For instance, the company uses air-cooled cascade refrigeration systems. During hot days, discharge temperatures and pressures can rise to elevated levels, leading to hardware failure. Advanced metrics and predictive analytics detect this situation, so operators can intervene and turn down the system throughput until the condition has cleared.
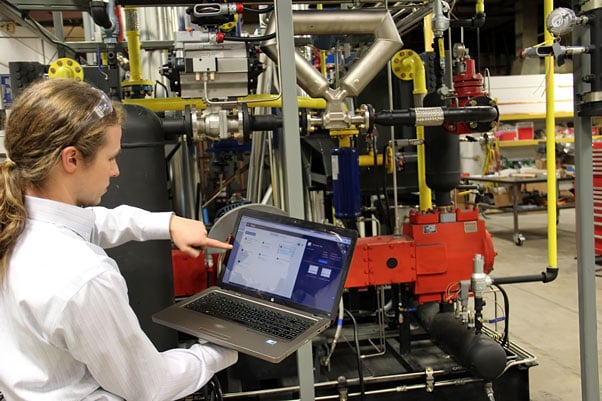
All data from the well site is streamed to a centralized, secure data center, where the analytics server resides and accesses all field data. From there, the visual analytics application software interface is made available via a web proxy server. Technicians and engineers can access the data anywhere there is a network connection, including at the well site itself with a cellular hot spot (figure 4).
 Figure 4. Well-site data is processed and made available via a web server. It is available anywhere in the world to engineers—even at the well site, as the author demonstrates.
Installation and startup
The visual analytics application software vendor performed two on-site training sessions in additional to remote installation and code development help sessions. The software application engineers identified an unusual issue causing an installation failure. The vendor's subject-matter experts were made accessible through a web proxy server, which involves multiple port forwarding and security rules. Due to the many operations tools running on the server, there was a port conflict. A quick live session with the vendor identified the issue. Other than this issue, installation and startup proceeded as planned without a hitch.
Results
The single biggest outcome of the visual analytics application software installation is improved operational intelligence. The applications are simple to use, yet powerful visualization and analysis tools shed light on otherwise complex processes. There are many possibilities, and the only challenge now is deciding which mystery to tackle next, because the solution to any problem can be quickly determined. At this point, the next objective is to increase visual analytics application software uptake and adoption throughout the organization as a fundamental design and operations tool.
A version of this article also was published at InTech magazine.


