
This guest post is authored by Tim Gellner, a senior consultant with MAVERICK Technologies.
Prior to the ISA Automation Week 2013 conference, I wrote a blog post titled “Measuring the Value of Overall Equipment Effectiveness in Manufacturing Processes.” The post outlined several key elements needed to implement a successful overall equipment effectiveness (OEE) program. The last element discussed was the need to  standardize methods for data analysis using process behavior charts. This article discusses the properties and uses of process behavior charts in analyzing process data using the OEE example.
As automation professionals we design and implement systems that gather data from every process in a manufacturing facility for use in aggregating performance metrics. Often the analysis of the data and subsequent visualization of the metrics fall under IT and accounting rather than operations and engineering, resulting in standard business type charting (bar charts, pie charts, waterfalls etc.) which describe the data but generally do not lend themselves to statistical analysis of the data for continuous improvement.
In the book Understanding Variation – The Key to Managing Chaos, Donald J. Wheeler writes:
We analyze numbers in order to know when a change has occurred in our processes or systems. We want to know about such changes in a timely manner so that we can respond appropriately. So, in our analysis of numbers, we need to have a way to distinguish those changes in the numbers that represent changes in our process from those that are essentially noise. To this end Walter Shewhart made a crucial distinction between two types of variation in the numbers. Some variation is routine, and is to be expected even when the process has not changed. Other variation is exceptional and therefore to be interpreted as a signal of a process change. In order to separate variation into these two components he created the control chart, which is now being called a process behavior chart.
As with the control chart, the process behavior chart is comprised of both an individual value (I) chart and a moving range (mR) chart. The upper and lower control limits are referred to as the upper and lower natural process limits within the context of the process behavior chart.
The individual values for OEE measurements of the process, the average of the values, and the upper and lower natural process limits (UNPL and LNPL) are plotted on the I chart. The UNPL and LNPL are computed by adding and subtracting the product of a scaling factor (2.66) and the average moving range, which yields limits of ±3 sigma. The mR chart displays the variation for each measurement from the previous measurement, the average of the moving range, and the upper range limit (URL). The URL is calculated by the product of a scaling factor (3.268) and the value of the average moving range. The result is a filtering effect of the routine variation. By characterizing the extent of the inherent routine variation, the natural process limits on the process behavior chart provide for the differentiation between routine and exceptional variation.
A predictable process is one that exhibits only routine variation which can be defined as measurements falling above and below the average in non-sustained patterns (less than seven consecutive values on the same side of the average) and inside the limits. This type of variation is expected.
Exceptional variation indicates that a change has occurred in the process and is characterized by one or more of the following;
- One or more measurements which fall outside the natural process limits.
- Seven or more consecutive measurements falling on the same side of the average.
- Six or more consecutive measurements aligned in the same direction (upward or downward).
Each component data set contributing to the overall OEE measurement (e.g. availability, performance and quality) is analyzed using the same methods. This provides a natural drill-down to more granular information providing the basis for root cause analysis when an investigation is warranted, or when determining the best candidate for improvement in a predictable process to increase the overall performance.
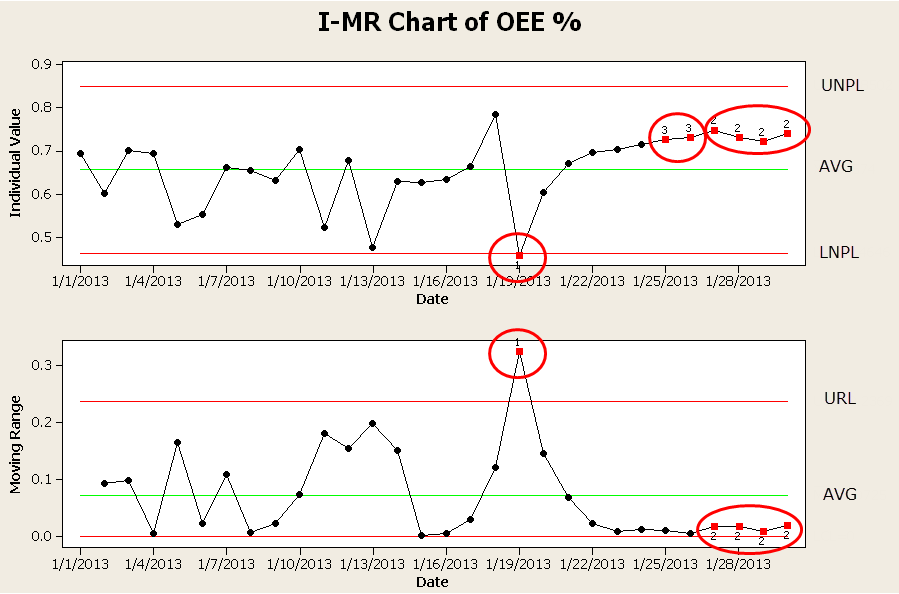 The chart depicts a predictable process that has undergone a change on or about 1/19 resulting in the 1/19 OEE data point being outside the lower natural process limit on the I chart. All values on the I chart prior to 1/19 represent routine variation, the value on 1/19 represents exceptional variation and requires investigation.
The chart also contains signals indicating that an additional process change has occurred as early as 1/22 but certainly by 1/26 when the sixth consecutive OEE value was above the process average and all six points are in the same direction. This signal indicates; that a change in the process has occurred (the OEE percent has increased and the variability has decreased), that the attributes of the change can be identified through more in depth analysis of the component data sets, and that the natural process limits have also changed and must now be re-calculated.
To promote and implement continuous improvement in manufacturing processes, the manner in which we analyze the data is as important as having the data to begin with. We must employ the appropriate analytical tools to filter out the noise and highlight the signals, and then act on the signals.
 About the Author
Tim Gellner is a senior consultant in MAVERICK Technologies’ Operational Consulting group with more than 20 years of experience in discrete and continuous manufacturing processes, manufacturing intelligence, and process improvement. He earned his bachelor‘s degree in systems and control engineering from the University of West Florida in Pensacola, Fla. Contact Tim at: tim.gellner@mavtechglobal.com.

